Business Intelligence & Analytics

Data analytics and reporting: dashboards built from your accounting, CRM and operational systems

Business intelligence dashboards and data analytics for Australian businesses

Clear Answers

Why? Your business creates data every day in your accounting software, CRM and project tools, but it sits in separate systems and nobody puts it together. We connect it and turn it into dashboards and reports that show what's happening and what needs attention.

The Data Visibility Problem

Most businesses have more data than they realise. The problem is not the data β€” it is getting to it.

🧩

Your data is everywhere except where you need it

Sales figures are in one system, costs in another and customer details somewhere else, so nobody has the full picture of what is going on.
⏱️

Reports take too long to produce

Someone spends hours pulling numbers from different systems, copying them into a spreadsheet, and hoping the formulas are right. By the time the report is done, the numbers are already old.
πŸ“Š

You are making decisions on gut feel

Without easy access to reliable data, decisions get made based on memory, anecdote, or whatever number someone can find quickest. Some of those decisions are expensive.
πŸ”’

Your spreadsheets have become the system

What started as a simple tracking sheet has grown into a complex workbook that only one person understands. If they leave, the knowledge goes with them.

What We Build

Practical analytics tools that answer the questions you ask every week β€” not impressive technology for its own sake.

Live Dashboards

Dashboards that pull data from your accounting, project management and other systems into one view, and update themselves so nobody has to put them together.

Automated Reports

The Monday morning report that used to take half a day to build arrives in your inbox automatically, with the same numbers and without anyone building it.

Data Connections

We connect your existing systems β€” Xero, MYOB, CRMs, project tools β€” so data flows into your dashboards without anyone retyping it.

Alerts That Matter

Get told when something needs attention, such as a job going over budget, an overdue payment or a key number heading the wrong way. Only the alerts that count, not a flood of them.

How We Work

1
Understand your questions

What decisions do you make every week? What information do you wish you had? We start with the questions you need answered, not the technology.

2
Connect your data

We link your existing systems (accounting, CRM, project management, spreadsheets) so the data comes together in one place without anyone retyping or copying it.

3
Build dashboards you will use

We create clear, simple views of the numbers that matter to your business. We show you a prototype early so we can adjust before building the full thing.

4
Train and support

We make sure your team knows how to read the dashboards and run the reports, and we are on hand when you need changes or new views.
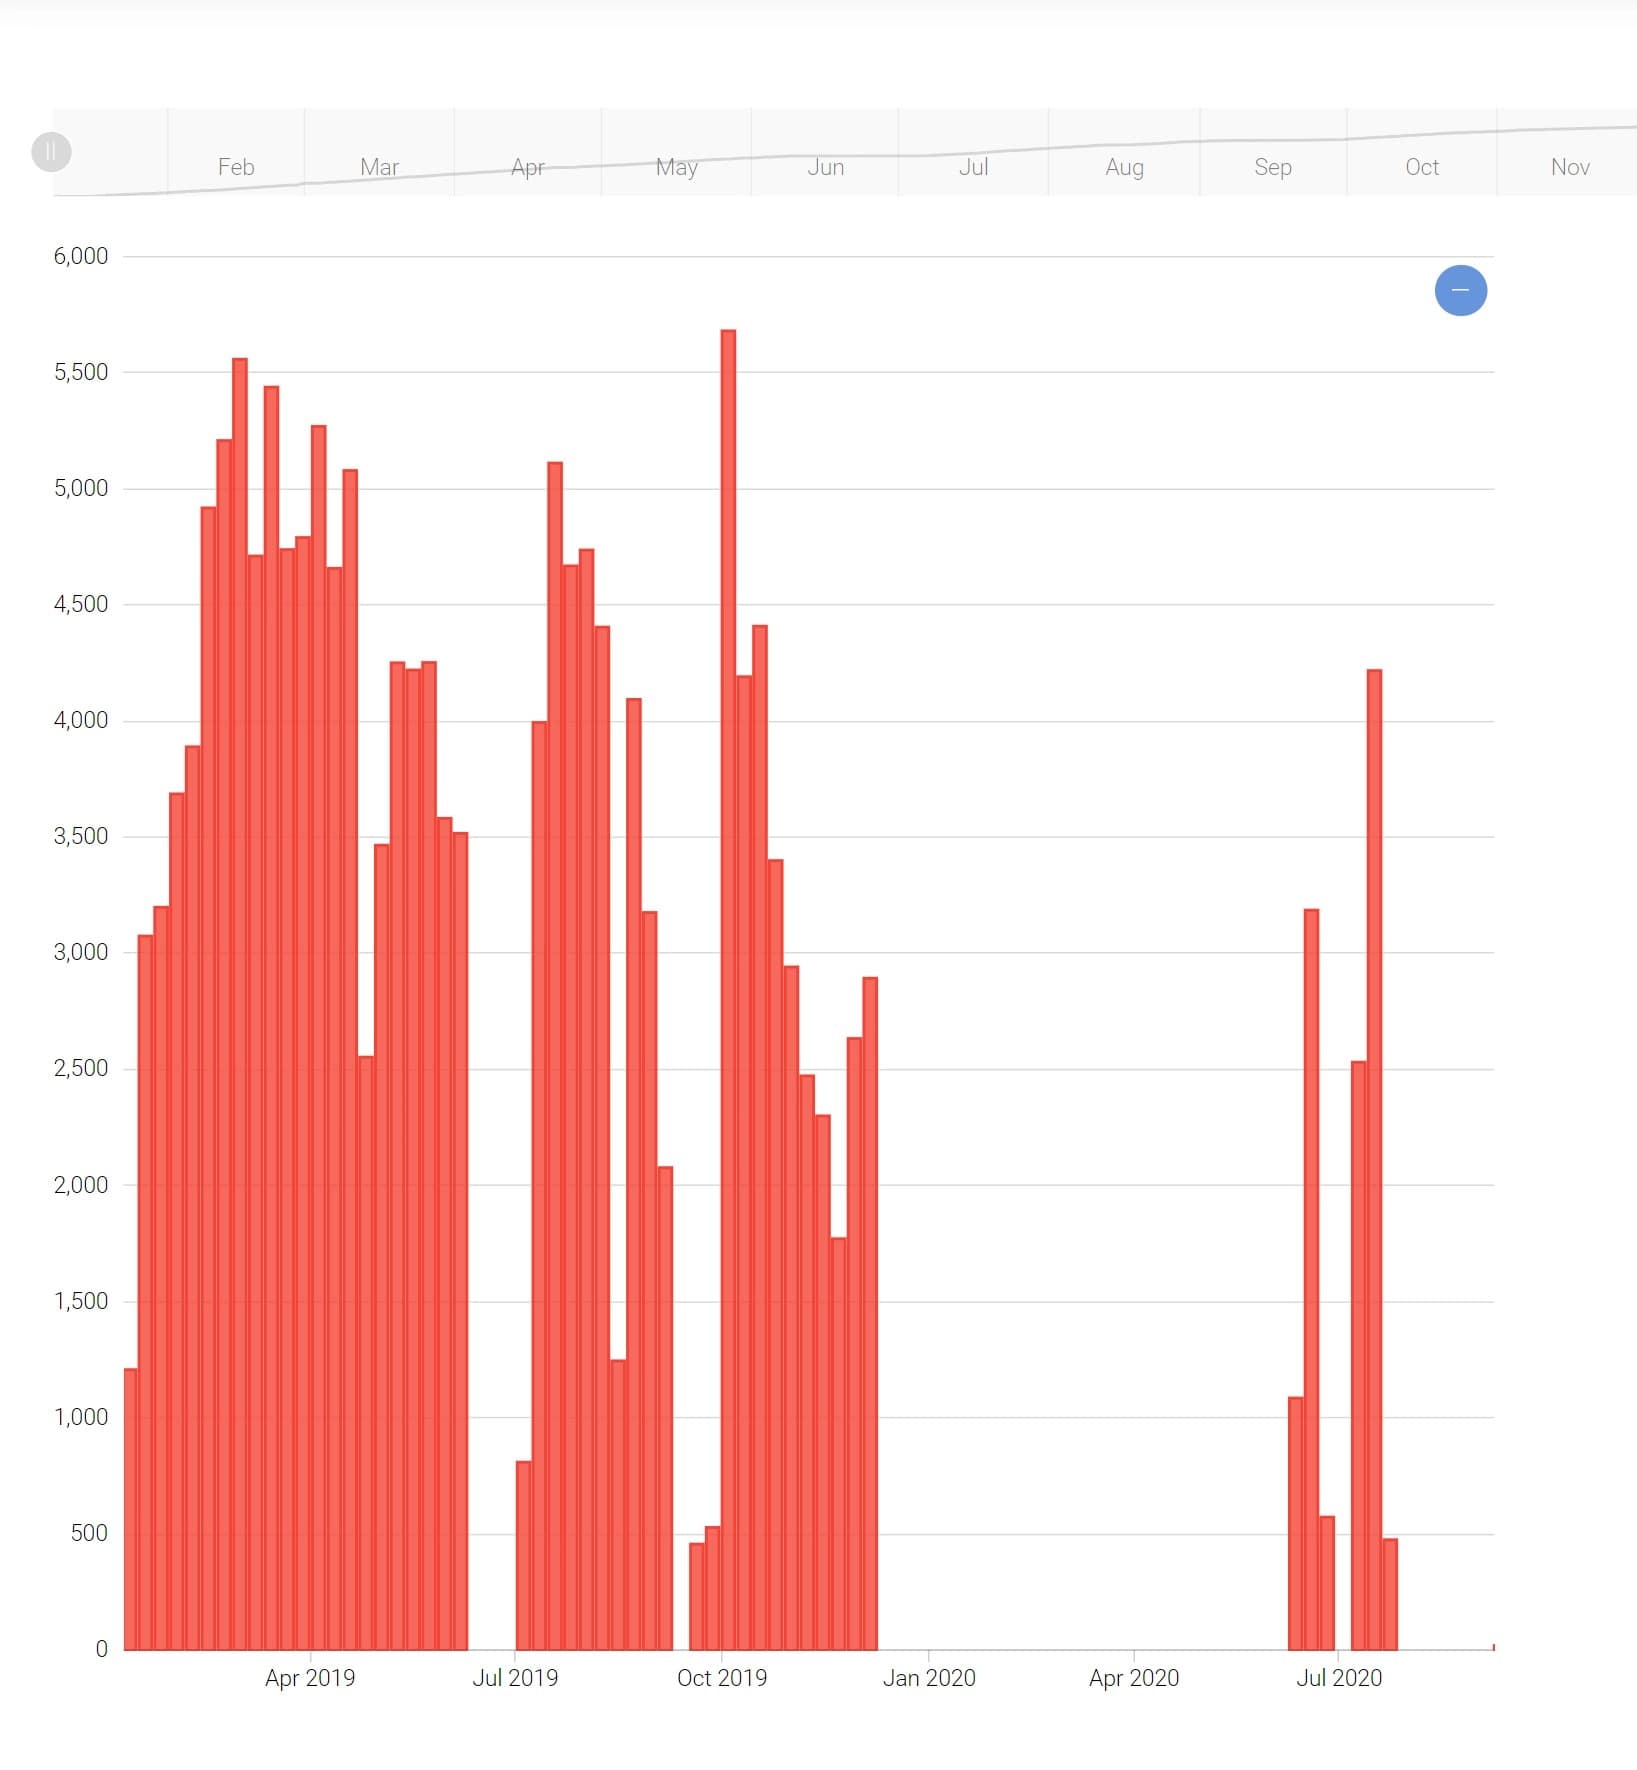
Business analytics dashboard showing real-time KPIs and metrics

Frequently Asked Questions

Mostly Power BI, because it works well with Xero, MYOB and the other tools most Australian businesses use. But we pick the tool that fits your situation, not the fanciest one.

A focused dashboard drawing on two or three systems typically takes 2-4 weeks. Bigger setups take longer, but we always start with a working prototype you can see and use early.

Most businesses don't. We can usually connect straight to your existing systems. If your data volume or complexity calls for one, we'll explain why and keep it simple.

Get Clear Answers From Your Data

Tell us which questions you wish your data could answer, and we'll show you the simplest way to get those answers.